I know I have heard this too many times this summer, “there’s NO WAY I used this much water!” “It’s impossible!” “The meter must be wrong,” or some version of “the City isn’t really reading the meters, but estimating.” Well, let me tell you, it IS possible to use a lot of water (I’m talking 30,000 gallons, 50,000 gallons, 70,000 gallons…or more!). I’ve seen it. A lot. I have seen it due to leaks, or from sprinkler systems, but I’ve never seen it from someone stealing water from their neighbor! (ha! People say that a lot too.)
I say this with 15 years of experience behind me doing this type of work. So, not just this year, but over many years of looking
at sprinkler systems and how they are set and reading water meters. I still get surprised that people are surprised to find out that high water use is possible and the City ISN’T wrong. We just really use more water than we realize we do, especially when it comes to sprinkler systems. This really boils down to an education problem.
When we receive our bill, we automatically look at how much we owe, right?!? I know I do. That’s what really affects me anyway, how much do I owe the City? What we really need to look at is what’s included in that final cost AND actually look at the gallons of water that we used. That will tell you much more than the amount you owe.
On Round Rock’s water bill, what’s also included in that cost (besides the water), is wastewater (sewer) charges, gar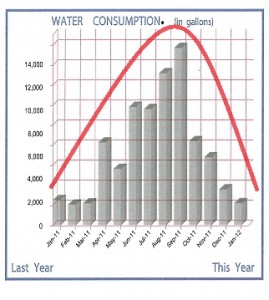 bage and recycling collection, stormwater (or drainage) fees, and taxes. The water portion of the cost is maybe less than half of what the actual amount is you owe.
Look at that little graph. That shows you the gallons of water your household has used that month, and the past several months. It’s also under the “water” section of the bill on the back. That’s a better way to judge how much water you are using each month. [Of note, a very average amount of water used each month is 2,000 gallons per person, per month. Again, that’s pretty average.] If you are using more than that for your family, you may check toil
ets for leaks, or consider replacing any old toilets with new, efficient ones (remember, the City has a rebate for that), and bring your water use down.
Also, the graph should, ideally, be shaped like the one in picture, that’s what we expect to see. It’s a bell curve: Low use in the winter, a little higher in spring, peaking–the highest–in summer with the highest month usually August or September, then lower in fall and back to lowest in winter. That’s a water use curve that is expected and means you are paying attention to the seasons, and the weather patterns and not using water outdoors when not needed (winter).
The water rates will go up, so just looking at the dollar amount isn’t always helpful, or provides any insight to what you’re using. I challenge you to look at your bill in more detail this month!